- Full Atomistic MD
- Mechanical / Viscosity / Viscoelasticity
- Interface / Phase Separation / Particle Dispersion
- Materials Science
Polymer/Solid Interface Friction
Friction between amorphous polyethylene (PE) and a graphite wall were calculated using full atomistic MD.
Figure 1 shows the model overview. The J-OCTA system modeler was used to create the interface model. Carbon is drawn in white and hydrogen is drawn in blue. The X-axis and Y-axis represent the periodic boundary. The Z-axis represents the reflective boundary at the relaxation calculation time. After relaxation, the atoms at the top of the PE layer were solidified, which created no boundary conditions. The temperature was set to 100 K, and so the PE formed a glass state.
For the graphite wall, the entire wall was moved at a constant speed toward the interface along the X-axis. The migration speed was set to 2.5 m/sec.
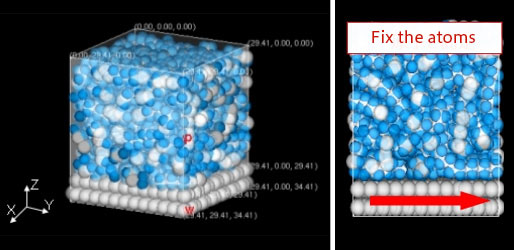 Figure 1. Interface Model of PE and Graphite Wall
Figure 2 shows the stress, which moves horizontally along the interface placed on the surface atoms of the graphite wall. A positive stress is set in the opposite direction of the moving wall. Average values are expressed with the dotted line.
Thus, the friction coefficient in microscale can be calculated from the above calculations using the horizontal and vertical stress placed on the wall.
 Figure 2. Changes in Horizontal Pressure Over Time of the Interface on the Wall Surface
- Reference
- [1] A. P. Awasthi, D. C. Langoudas and D. C. Hammerand, Modeling Simul. Mater. Sci. Eng. 17 (2009) 015002