- Quantum Chemistry / DFT
- Optical / Electrical / Magnetic
- Materials Science
[Case study] Absorption spectrum of metal complex
Objective and methods
Absorption spectra are a useful and widely used method of measuring the optical properties of molecules.
SIESTA's OpticalCalculation function can be used to calculate absorption spectra of molecules and solids. In this case study, we introduce an example of applying this calculation function to the absorption spectrum of a few complexes.
Since the OpticalCalculation function can calculate spectra in a wide range of energy regions at a relatively low cost, it is useful for confirming the approximate shape of the spectrum. In the following SIESTA calculation, we used the PBE functional, but be careful when directly comparing absorption peaks with experiments, because GGA functionals like PBE underestimate the HOMO-LUMO gap. When comparing with experiment, the gap can be adjusted by the Scissor operator.
In the following, we show an example calculation for the absorption spectra of an Ir complex, a well-known organic EL material, and two Pt complexes with different ligand structures.
Example 1
The following is an example of calculating the absorption spectrum of Ir complex, Ir(ppy)3, which is known as a phosphorescent OLED material.
The absorption spectrum calculated by SIESTA is shown in Fig. 1. Yoshida et al. reported that the long wavelength side of this complex has an absorption peak at 373 nm [1]. Several absorption peaks on the short wavelength side can also be confirmed by the absorption spectrum observed in the experiment.
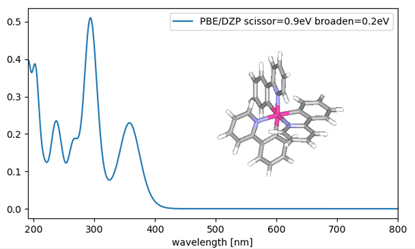 Fig.1 Absorption spectrum of Ir(ppy)3
Example 2
The absorption spectra of Pt complexes (Pt1 and PT2) were calculated. Comparison of the two absorption spectra shows that Pt2 has a large absorption intensity around 400 nm and Pt1 has a relatively large absorption intensity at 450-500 nm , which are consistent with the features of the experimental absorption spectra [2]. These features are consistent with those of the absorption spectrum observed experimentally [2].
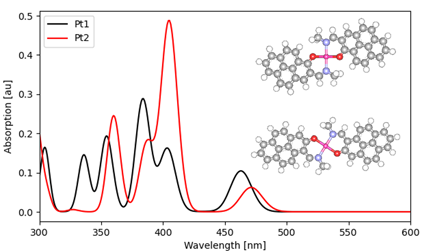 Fig2. Comparison of absorption spectra of two types of Pt complexes
- Reference
- [1] Yoshida et al., Bunshi-Kozo Sogo Toronkai, 2003, 4Pa071
- [2] X.-D. Luong and X.-T. Nguyen, Crystals, 10, 476 (2020). https://doi.org/10.3390/cryst10060476