- Full Atomistic MD
- Thermal
- Materials Science
![]() User Only
User Only
Glass-Transition Temperature Evaluation
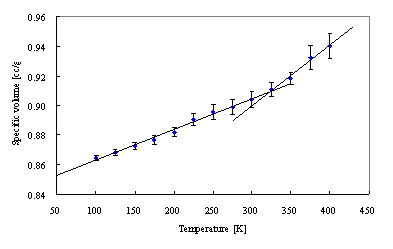
Using the MD engine COGNAC, we can evaluate the glass-transition temperature Tg of polymers. Specifically, a system is set to a high temperature, and as the temperature drops at regular intervals (quench), the changes in system volume are evaluated. As a result, when the folding point in the volume change appears, the temperature at that point represents the glass-transition temperature.
We have evaluated the glass-transition temperature using data from polymers in an amorphous state. Figure 2 shows the specific volume of the temperature changes for a system of polyethylene in an amorphous state. Each change in volume has a temperature at which the volume change dramatically varies, and these temperatures are used to determine the glass-transition point.
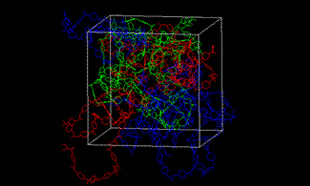
 Figure 1. Polycarbonate in a Bulk State
 Figure 2. Specific Volume with Temperature Changes for a Polyethylene System
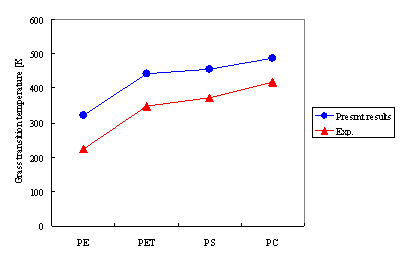
The glass-transition temperatures for various substances were calculated. The tendency of each substance was captured by graphing the results of the various substances. There are a few reasons why the calculated Tg values are higher than experimental data values. One is that the quench speeds of the MD calculations are extremely fast. Additionally, the degree of precision for these calculations is limited. However, these calculations can be used to generate sufficient qualitative evaluations.
 Figure 3. Glass-Transition Temperatures of Each Polymer
| Material | Tg (Calculated) [℃] |
Tg (Experimental) [℃] |
Density (Calculated) [g/cm3] |
Density (Experimental) [1] [g/cm3] |
|---|---|---|---|---|
| Polyethylene | 48.64 | -50 | 1.11 | 0.9 |
| Polyethylene terephthalate | 169.41 | 75 | 1.28 | 1.38 |
| Polystyrene | 183.03 | 100 | 1.06 | 1 |
| Polycarbonate | 215.06 | 144 | 1.12 | 1.2 |
- Reference
- [1] Extracts from Polyinfo Database


