- DPD / Mean Field
- Multiscale Analysis
- Interface / Phase Separation / Particle Dispersion
- Materials Science
- Life Science
Evaluation of Interfacial Tension Using DPD
We used DPD to calculate the interface tension between water and octane. Octane was expressed with three DPD particles, and water was expressed with one DPD particle. Because the volume of each particle was set to the volume of three water molecules, the standard volume Vbead was 54.3 [cm^3/mol], the system number density was (ρ=3), and the unit length was Rc is 6.46 [Å].
![]()
The repulsion parameter applied to each bead was derived from the following equations, which require the solubility parameter δ from the full atomistic model MD calculation (Table 1). The resulting value for the water/octane particle parameter was aij = 120.1. Furthermore, the particle parameter for particles of the same type was aii = 25.
| Material | V [cm^3/mol] |
δMD [(J/cm^3)^(1/2)] |
δexp[1] [(J/cm^3)^(1/2)] |
|---|---|---|---|
| water | 18.1 | 52.6 | 47.9 |
| octane | 162.6 | 16.0 | 15.6 |
![]()
![]()
Figure 1 shows the water/octane interface model using DPD particles. After setting the DPD particles to 3000 water molecules and 1000 octane molecules and arranging the formation of the interface, we used COGNAC to perform the calculations. The interface was maintained after relaxation, and the following formula was used to compute the interface tension from the stress values in various directions. Also, the unit length was used to give the interface tension a dimension. The above calculation resulted in a water/octane interface tension of 50.1 [dyn/cm]. These results compare well with the experimental data values of 51.7 [dyn/cm] [1].
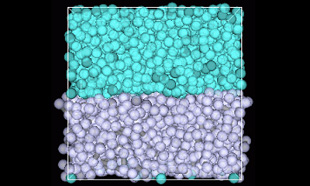 Figure 1. Interface Model (Upper area is water, lower area is octane)
 Figure 2. Changes in Interface Tension Over Time
Figure 3 shows the interface tension aij dependency of this model. At aij >30 the tension splits into two phases, and aij increases with increasing interface tension.
 Figure 3. Relationship Between Interface Tension and aij
- Reference
- [1] A. Maiti and S. McGrother, J. Chem. Phys., 120, 3, 15 (2004)