- Full Atomistic MD
- Optical / Electrical / Magnetic
- Materials Science
Evaluation of Relative Permittivity Using MD
By using the full atomistic model to perform MD calculations, the relative permittivity at a temperature of 300 K was evaluated for water, octane, benzene, ethanol, and methanol. Calculations for water were made using the SPC-FW model. All other molecules were calculated using J-OCTA modeling (GAFF was used for the force-field values, and MO calculations were used for the charge values). A single-composition system was created for each molecule. The number of molecules was set to approximately 700 particles, and the boundary was set to periodic boundary conditions. The MD calculations were made using our solver VSOP.
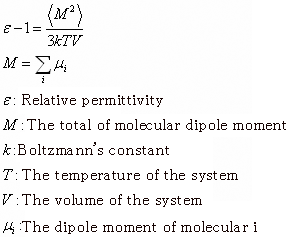
After performing MD calculations with the NTP ensemble at 300K and relaxing the system, further calculations were performed to obtain time series data for the evaluation of relative permittivity. The relative permittivity computations were made using the following formula [1].

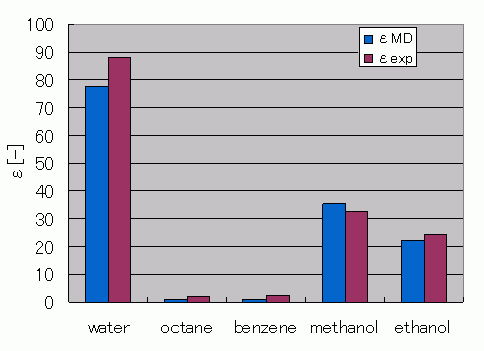
Figure 1 shows a comparison between the relative permittivity experimental data and the results obtained through the MD estimations. The simulation results are similar to the experimental results. However, for materials with small electron biases inside the molecules, such as octane and benzene, the estimated relative permittivity values have a tendency to be lower than expected.
 Figure 1. Comparison of Relative Permittivity Values Obtained from MD Calculation Estimations Against the Experimental Data
| ρMD [g/cm^3] | εMD[-] | ρexp [g/cm^3] | εexp[1,2,3] [-] | |
|---|---|---|---|---|
| water | 1.01 | 77.7 | 1.00 | 88.2 |
| octane | 0.69 | 1.06 | 0.70 | 1.95 |
| benzene | 0.85 | 1.04 | 0.88 | 2.28 |
| methanol | 0.83 | 35.2 | 0.79 | 32.6 |
| ethanol | 0.82 | 22.1 | 0.79 | 24.3 |
- Reference
- [1] N. Yoshii, S. Miura, S. Okazaki, Chem. Phys. Lett. 345 (2001) 195-200
- [2] Chronological Scientific Tables 2005 Maruzen
- [3] Chemistry Handbook 2004 Maruzen


