- Full Atomistic MD
- Mechanical / Viscosity / Viscoelasticity
- Interface / Phase Separation / Particle Dispersion
- Materials Science
Polymer/Solid Interface Peeling
Delamination between amorphous polyethylene (PE) and a graphite wall was calculated using full atomistic MD.
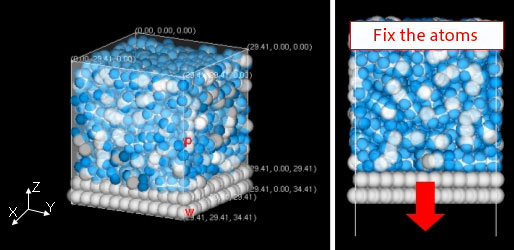
The J-OCTA system modeler was used to create the interface model between PE and the graphite wall. Figure 1 shows the system modeler screen and an overview of the model. Carbon is drawn in white and hydrogen is drawn in blue. The X and Y axes represent the periodic boundary. The Z-axis represents the reflecting boundary during the relaxation calculation. After relaxation, a calculation for the Z-axis was performed to solidify the upper atoms with no boundary condition and then proceed down the graphite wall. Lastly, the temperature was set to 100 K, making the PE form a glass state. Although it is extremely fast, we set the wall transition speed to 25 m/s.
 Figure 1. Interface Model of PE and Graphite Wall
Fix the atoms
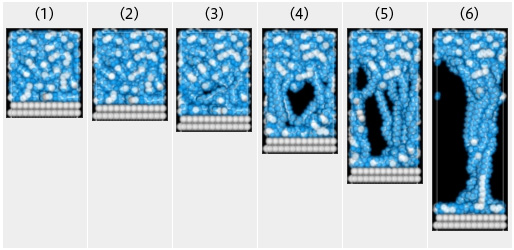
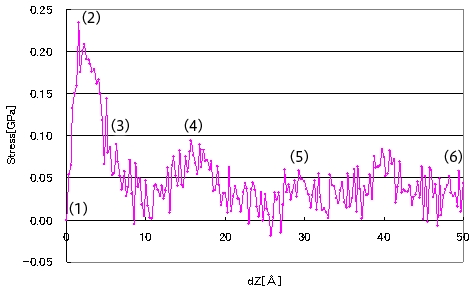
Figure 2 shows an image of each phase of the delamination process. There is also a graph that plots the wall displacement versus the vertical stress that is applied to the wall surface. The numbers in the graph correspond to the image number. From the default state (1), the stress increases due to the movement of the wall. After the stress reaches its peak value (2), the stress falls rapidly and creates a void (3). After this point, delamination occurs with the wall movement (4)-(6).

 Figure 2. Changes in Stress Applied to the Wall During the Delamination Process
- Reference
- [1] A. P. Awasthi, D. C. Langoudas and D. C. Hammerand, Modeling Simul. Mater. Sci. Eng. 17 (2009) 015002


