- Other methods
- Interface / Phase Separation / Particle Dispersion
- Materials Science
Estimation of χ Parameters from Phase Diagrams
We estimated the χ parameter using the Flory-Huggins theory and cloud point data [1] from PS/PB miscible systems, as shown in the UCST phase diagrams. In this case, the χ parameter concentration dependency is a weak system, so the χ parameter was simplified with the following expression.
![]()
Figure 1 shows the estimation results. The axis represents the PS volume fraction, and the Y-axis represents temperature. By entering the experimental values in this manner, we were able to obtain a coexistence curve and a spinodal curve.
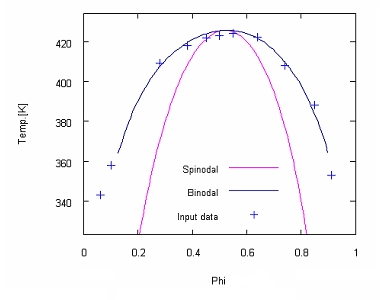 Figure 1. Coexistence Curve and Spinodal Curve of Experimental Data
- Reference
- [1] R. J. Roe, W. C. Zin, Macromolecules, 13, 1221 (1980).