- Full Atomistic MD
- Thermal
- Materials Science
Evaluation of Heat Storage Materials with J-OCTA
Calculating the Latent Heat of Melting of Sugar Alcohols
Purpose and method
In order to evaluate the performance of sugar alcohols as heat storage materials, latent heat evaluation by molecular simulation was performed using J-OCTA. The target molecule was mannitol. The crystal structure of mannitol (C6H14O6) was obtained from the Crystallography Open Database (COD) (http://www.crystallography.net/) as a CIF file. The force field and atomic charges were parameters from a previous study[1].
Molecular dynamics was used to determine the latent heat at the melting point. First, we perform temperature jumps from the crystalline state to each temperature, and then check whether the material melts at a constant temperature or not. The latent heat of fusion is defined as the difference between the enthalpy in the crystalline state and the enthalpy in the molten state at the minimum temperature at which it melts. The ensemble is NPT_Parrinello_Rahman_Nose_Hoover, so the cell sizes in the X-, Y-, and Z-axes were controlled by pressure independently. The temperature was set from 300 K to 500 K. Calculations were performed for 1 ns at each temperature to see if the melting occurred within 1 ns.
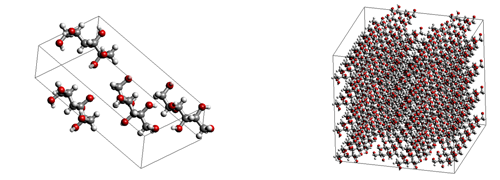 Figure 1 Left : The unit crystal model of mannitol, Right : The calculation model
Simulation results
The melting point was confirmed to be 440 K based on the density change. It was visually confirmed that the structure of the model changes significantly at the melting point. The changes in density and structure before and after melting are shown in Figure 2.
The enthalpy results at each temperature are shown in Figure 3. Based on the enthalpy change at the melting point of 440 K, the latent heat of melting was evaluated to be 196.8 kJ/kg. The experimental melting point was 440 K and the latent heat of fusion was 290 kJ/kg. In conclusion, the MD results were very good for the melting point but slightly low for the latent heat of fusion.
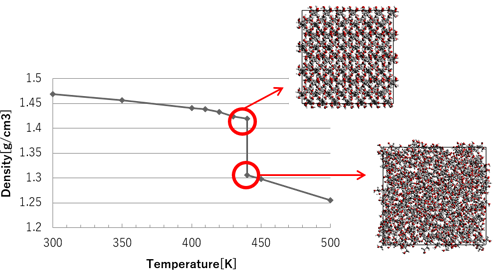 Figure 2 Density results, and structural changes before and after melting point
 Figure 3 Enthalpy result
- Reference
- [1] H. de Waard J. Phys. Chem. B 2010, 114, 429–436
- [2] Inagaki, Ishida, Analysis of theoretical properties of sugar alcohols as latent heat storage materials, Proceedings of the Annual Meeting on Molecular Science, 2014