- Other methods
- Mechanical / Viscosity / Viscoelasticity
- Materials Science
[Analysis Example] Viscoelastic master curve using simulation results
Conversion from relaxation modulus to dynamic modulus
J-OCTA includes several methods to calculate viscoelastic master curves from the relaxation modulus data obtained as simulation results.Examples of two methods will be presented here.
The first, i-Rheo GT, developed by Dr. M. Tassieri at the University of Glasgow, is a computational method that performs Fourier transforms based on the properties of rheological tests [1][2].
Even with a limited number of data points, fast evaluation is possible without parameters.
Figure 1 shows an example of application to a viscoelastic solid, which was performed as a validation. FFT shows inappropriate behavior at low frequencies, but i-Rheo GT shows good agreement with theory.
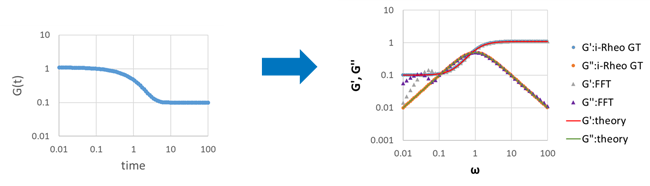 Fig.1 Viscoelastic solid
Figure 2 shows the results using the relaxation modulus G(t) obtained with coarse-grained MD (Kremer-Grest model, polymer chain length = 200), showing good agreement between FFT results and i-Rheo GT results.
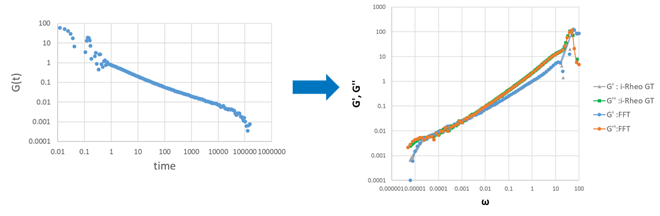 Fig.2 Evaluation of viscoelastic master curve using relaxation modulus
obtained by Coarse-Grained MD
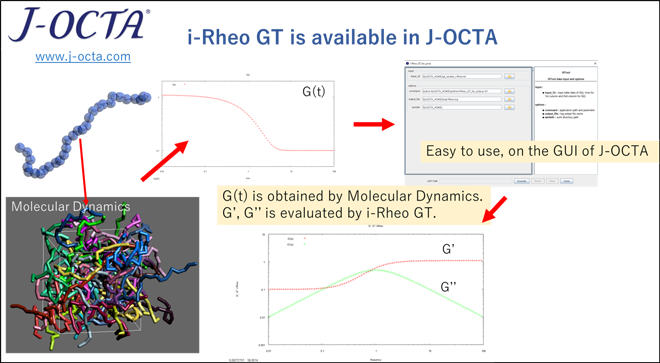 Fig.3 Schematic diagram of the collaboration between i-Rheo GT and J-OCTA
The second method is based on the generalized Maxwell model. The dynamic modulus of a viscoelastic material can be modeled using the generalized Maxwell model. In particular, the material model used for Finite-Element Analysis (FEA) is often specified in terms of Prony series coefficients.
In this section, we use the nonlinear least squares method to fit the time series data of the relaxation modulus G(t) to the Prony series and evaluate the coefficients of the series. From the resulting model, the dynamic modulus can be obtained. Figure 4 shows an example of fitting the relaxation modulus obtained from a simulation to a Prony series to obtain the final viscoelastic master curve, and the Prony series data can be easily used in Finite-Element Analysis (FEA).
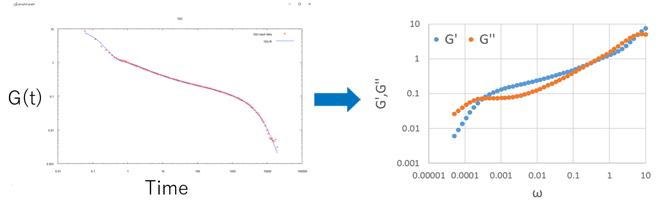 Fig.4 Evaluation of viscoelastic master curves using the generalized Maxwell model
In the left figure, the red dots are the input data and the blue line is the fitted result.
- Reference
- [1] M. Tassieri, et al., Macromolecules 51, 14, 5055–5068 (2018)
- [2] M. Tassieri, et al., Journal of Rheology 60, 649 (2016) (2016's most read article in the Journal of Rheology)