- Data Science
- Thermal
- Optical / Electrical / Magnetic
- Materials Science
[Analysis Example] Estimation of boiling point, refractive index, and dielectric constant by using machine learning
Machine learning, transfer learning and linkage with first-principles calculation
courtesy of Industrial Technology Center of Wakayama Prefecture
This is a user case study [1-4] in which the J-OCTA machine learning function (MI-Suite) was used to create models for predicting properties of refractive index and dielectric constant as well as boiling point. The boiling point is a typical thermal property of chemical compounds. In the case of the refractive index, which is one of the important properties of resin optical materials used for lenses, etc., transfer learning is used to improve the prediction accuracy of silicon-based compounds. The electrical properties of resins are also attracting attention due to their usage in electronic circuits such as sensors, etc. Here, the prediction model for the relative permittivity, which affects the propagation speed of radio waves, is improved by adding the results of first-principles calculations as explanatory variables, in addition to descriptors from the chemical structure.
1.Boiling point 1)
We collected 870 data on boiling points, a typical thermal property for compounds, from literature, and compiled the data together with chemical structures in SMILES format and learned them using the graph convolution network (GCN) method. As a result, a learning model with good correlation was obtained. Figure 1 shows the correlation between experimental and predicted values. The results are good not only on the training data but also on the test data. Next, we compared the predictions of new target compounds with the measured values. The results for the two compounds are shown here, and the results show small deviation.
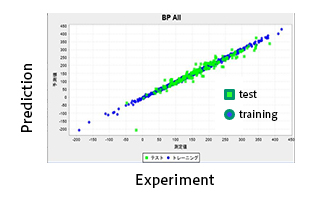 Fig.1 Results of the obtained machine learning model for Boiling Point
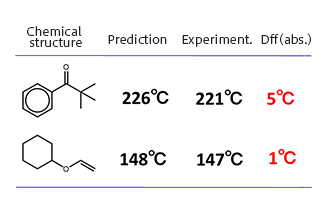 Fig.2 Comparison of predicted and measured values for target compounds
Refractive index 2)
A training model was created from 658 refractive index data collected from the literature, using the same procedure as for the boiling point. As a result, we were able to create a model that produced good prediction results for hydrocarbon compounds with various functional groups. However, in the case of compounds containing silicon, there was a large difference from the measured results. Therefore, we added data for 28 new silicon-based compounds and used transfer learning to improve the model. The advantages of transfer learning are that existing models can be effectively utilized and the learning model can be improved with a small amount of additional models, as well as in terms of computational cost. The model before transfer learning had a difference of about 0.05 from the measured value, but as a result of transfer learning, good prediction results were obtained.
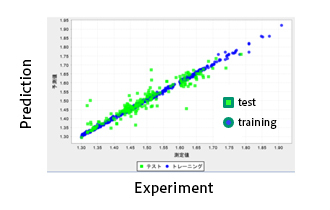 Fig.3 Results with initially created model
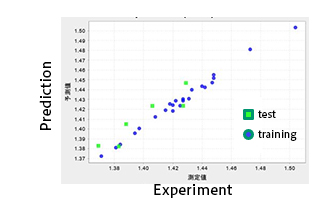 Fig.4 Results of Transfer Learning for silicon based compounds.
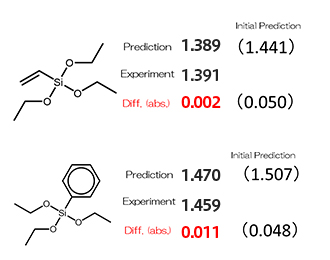 Fig.5 Comparison of predicted and measured values for silicon compounds
3.Dielectric constant of polyimide 3)
Polyimide is used in electronic circuit boards and other applications, and as it is used in the high-frequency range, materials with low dielectric constants are in demand. Here, machine learning is performed on 975 cases of polyimide data.4) The data includes not only chemical structures and dielectric constants but also results from first-principles calculations. Using the gradient boosting (XGBoost) with MorganFP, a 2D descriptor, as an explanatory variable, did not produce a model with good correlation. However, by including the results of first-principles calculations in addition to MorganFP as explanatory variables, we obtained good results showing better correlations.
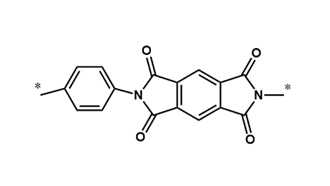 Fig.6 Examples of Typical Polyimide Compounds
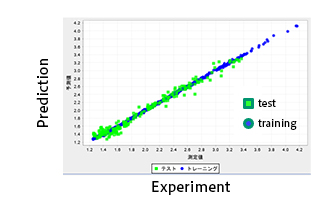 Fig. 7 Results of obtained machine learning model of dielectric constant
- References
- 1) https://www.wakayama-kg.jp/docs/keisankagaku-jirei-12.pdf
- 2) https://www.wakayama-kg.jp/docs/keisankagaku-jirei-16.pdf;
https://www.wakayama-kg.jp/docs/keisankagaku-jirei-17.pdf - 3) Presentation Material of Industrial Technology Center of Wakayama Prefecture (WINTEC) included in J-OCTA Special Lecture "Introduction of Materials Development by Materials Informatics"
- 4) “AIST Materials Gate Data Platform” (DPF)


