- Quantum Chemistry / DFT
- Thermal
- Materials Science
Thermal expansion of crystals
Purpose and method
Thermal expansion is a fundamental property of materials. It is well known that the higher the temperature, the greater the thermal expansion of ceramics. The thermal expansion of a material is expressed by the volume expansion coefficient αV or the linear expansion coefficient αL and can be calculated by the following formula;
\( \alpha \)V =\( \frac{ 1 }{ V } \frac{ dV }{ dT }(= 3\alpha \)L\( ) \)
The temperature variation in the crystal cell volumes of potassium (K) and KZP (KZr2(PO4)3) were studied using SIESTA. Materials with a low thermal expansion coefficient are attracting attention in the miniaturization of devices, and KZP is known as one of such materials.
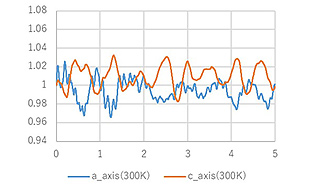
The volume V of a cell at a certain temperature was calculated by ab initio molecular dynamics (AIMD) using SIESTA. PBE functional and DZP basis function were used in this study. The average cell volume was calculated from the results of AIMD calculations of 10 ps and 5 ps for potassium and KZP, respectively.

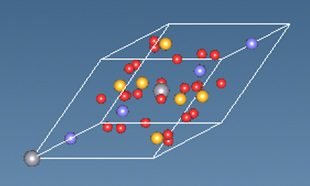
 Figure 1. KZP crystal cell and Time variation of cell length calculated by ab initio MD (Ratio to the initial value)
Calculation result
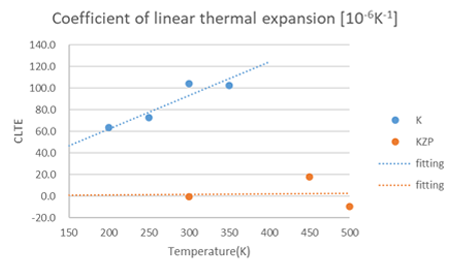
Figure 2 shows the linear expansion coefficient of potassium and KZP in the range of 200-500 K, calculated by AIMD. It shows that the thermal expansion of potassium increases with temperature. The linear expansion coefficients of potassium and KZP are reported to be 80 and -0.4 [10-6K-1], respectively [1,2], and the SIESTA results reproduce these differences in materials.
 Figure 2. Calculation results of the linear expansion coefficient
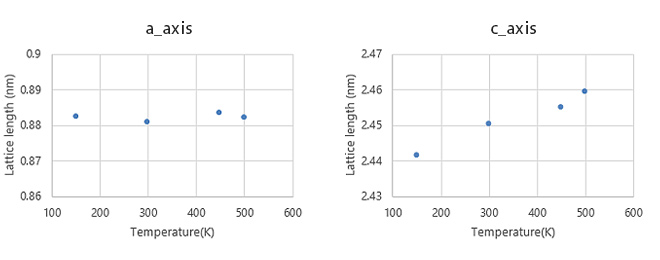
Furthermore, KZP is known to have an anisotropic expansion coefficient as well. Therefore, we investigated the temperature variation of each cell axis. Figure 3 shows the changes of the a- and c-axis lengths of KZP depending on the temperature. Experimental results show that KZP shrinks along a-axis and expands significantly along c-axis as the temperature increases [2], and the calculation results of SIETSA reproduce this trend.
 Figure 3. Temperature variations in the a and c axes of KZP
- Reference
- [1] V. K. Jindal and K. N. Pathak, Phys. Rev. B, 14, 3704 (1976)
- [2] Ota, Yamai, Yogyo-Kyokai-shi, 95, 1987 531


