- Quantum Chemistry / DFT
- Thermal
- Materials Science
Simulation of lattice specific heat
An example of obtaining specific heat characteristics reflecting the characteristics of each material by first-principles calculations
Purpose and method
The molar heat capacity at constant volume of materials can be obtained from the temperature derivative of the internal energy under the condition of constant volume. The lattice specific heat of monatomic characterizes the specific heat, and in this case study, the lattice specific heat of monatomic solids including metals is obtained by using the phonon analysis function of SIESTA modeler. The molar heat capacity at constant volume Cv of a material can be expressed by the following equation.

h: Planck constant
ν: Frequency of phonon
ƒB(ν): Bose-Einstein distribution function
Dlat(ν): Phonon density of states at frequency ν
This analysis requires information on the phonon density of states for each material.
The phonon analysis function of SIESTA modeler can output the density of states along with the phonon bands. This result can be used to determine the molar heat capacity at constant volume.
Simulation result
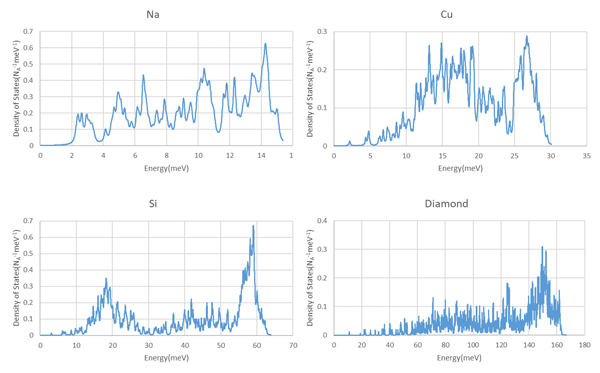
Figure 1 shows the calculated phonon density of states for Na, Cu, Si and Diamond using SIESTA modeler.
When the density of states is integrated by energy, the following results are obtained;
・3 for Na and C: longitudinal wave 1 and transverse wave 2 of the acoustic mode.
・6 for Si and diamond: longitudinal and transverse modes 1 and 2 for acoustic mode, longitudinal and transverse modes 1 and 2 for optical mode.
This indicates the number of states per mole.
 Figure 1. Phonon density of states of Na, Cu, Si, and diamond. NA is Loschmidt number
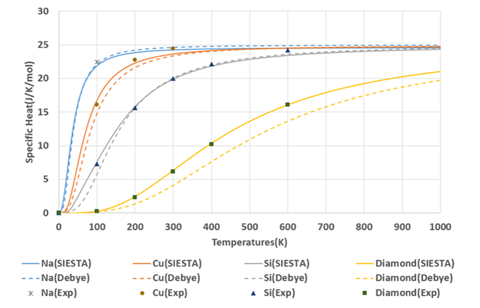
The molar heat capacity at constant volume of each element reflecting this density of states is shown in Figure 2. For comparison, the results from the Debye model are shown as dashed lines. Table 1 shows the Debye temperatures used in the Debye model. Since the Debye model assumes that the density of states of materials has a squared frequency response, the only difference between materials is the Debye temperature for each material. Therefore, the behavior of the specific heat normalized by the Debye temperature is identical for all Debye models.
The experimental values of the molar heat capacity at constant pressure are also plotted in Figure 2 for reference. Since the difference between the molar heat capacity at constant volume and the molar heat capacity at constant pressure becomes larger at higher temperatures, only the data of the molar heat capacity at constant pressure below the Debye temperature is used for comparison with the calculation results.
First-principles calculations can be used to obtain specific heat characteristics that reflect the characteristics of each material.
| Element | Debye temperature(K) |
|---|---|
| Na | 158 |
| Cu | 343 |
| Si | 645 |
| C | 2230 |
Table 1. Debye temperature for each element
 Figure 2. Comparison of the molar heat capacity at constant volume for Na, Cu, Si and diamond


