- Quantum Chemistry / DFT
- Mechanical / Viscosity / Viscoelasticity
- Materials Science
Derivation of the stiffness matrix using phonon dispersion curves
The elastic properties of a material can be completely described by a stiffness matrix. Each element of the stiffness matrix can be obtained from the phonon dispersion curves obtained by using first-principles calculations.
In this case study, we introduce an example of the analysis of the stiffness matrices of Si, Diamond and Cu single crystals with cubic structures.
Si is a cubic crystal with diamond structure as shown in Fig. 1, and its stiffness matrix is given as follows.
Due to the symmetry of the cubic crystal, there are three independent elements, \(C_{11}\),\(C_{12}\),and \(C_{44}\), which are derived from the results making use of the SIESTA modeler.
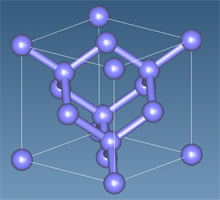 Fig. 1 Diamond structure of Si
 Stiffness matrix of cubic crystal
The phonon dispersion curve of Si was directly calculated using the SIESTA modeler (Fig. 2). Si has three acoustic modes and three optical modes due to the fact that the number of atoms in the unit cell is two. The crystal structure of Si is cubic with a diamond structure, and the dispersion curves show different dispersion characteristics for each crystal orientation. Here we will focus on the dispersion characteristics of the acoustic mode extending from the Γ point to the (1,0,0) direction, which is the X point direction, and from the Γ point to the (1,1,1) direction, which is the L point direction. The dispersion characteristics of the acoustic modes show linearity in the long wavelength region near the Γ point, and this gradient gives the sound velocity.
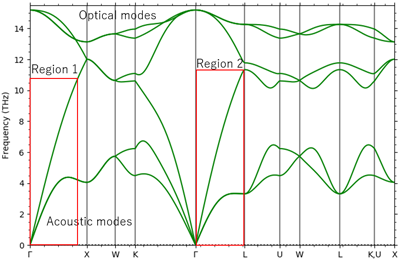 Fig. 2 Phonon dispersion curve of Si
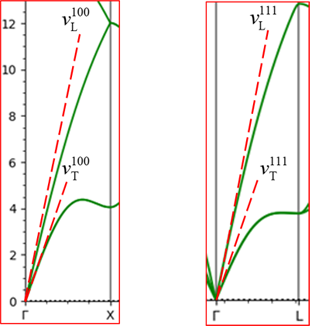 Fig. 3 Dispersion curves for regions 1 and 2
The dashed lines in the figure represent the sound velocity in each propagation direction near the Γ point, and the subscripts L/T represent longitudinal and transverse waves.
A sound wave propagating in the (1,0,0) direction consists of one longitudinal wave and two degenerate transverse waves, and their respective sound velocity and stiffness matrices are given by the following relations. From this result, \(C_{11}\) and \(C_{44}\) can be obtained. Furthermore, by using the obtained results and focusing on the sound wave propagating in the (1,1,1) direction, c12 can be obtained. In this case study, the gradient (sound velocity) at the Γ point was obtained by constructing an approximate curve using the third order of least-squares method for the acoustic modes in the regions 1 and 2 in Fig. 1, which were obtained by the phonon analysis function of the SIESTA modeler. From the obtained sound velocity, the stiffness matrix is calculated according to the following equation.
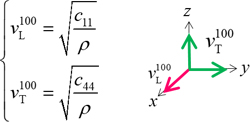
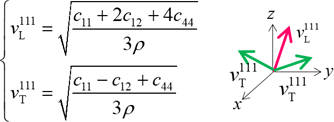 Relationship between sound velocity and stiffness matrix in the (1,0,0)/(1,1,1) direction.
Each arrow represents the direction of polarization, red arrow represents longitudinal wave, green arrow represents transverse wave. ρ represents the weight density of Si.
Table 1 shows the results of comparison between each element of the stiffness matrix obtained by the analysis and the literature values (C. Kittel, “Introduction to Solid State Physics”, in red brackets).
| Stiffness matrices | Si[GPa] | Diamond[GPa] | Cu[GPa] |
|---|---|---|---|
| \(C_{11}\) | 169(166) | 1088(1076) | 175(176.2) |
| \(C_{12}\) | 47.6(63.9) | 238(125) | 99.9(124.9) |
| \(C_{44}\) | 88.8(79.6) | 546(576) | 67.9(81.8) |
Table 1 Comparison of stiffness matrix with literature values